Are you curious about how mortgage rates have changed over the years and what that means for your home loan? Understanding the history of mortgage rates can give you a clearer picture of when to lock in a rate and how the market might move next.
This Mortgage Rate History Chart breaks down key trends, showing you how rates have risen and fallen through different economic times. By exploring this chart, you’ll gain insights that could save you thousands on your mortgage. Keep reading to discover the patterns behind mortgage rates and how you can use this knowledge to make smarter financial decisions for your home.
Mortgage Rate Trends Over Decades
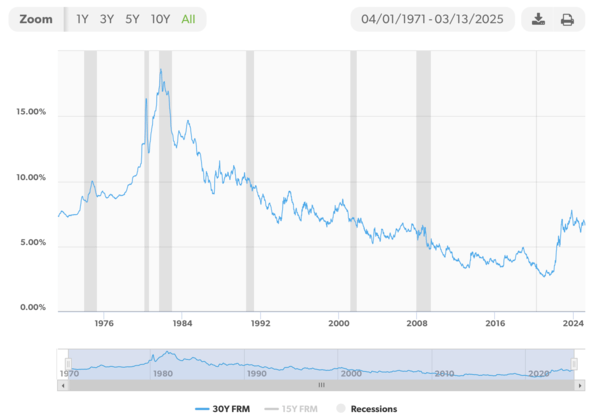
Mortgage rates in the 1970s and 1980s were very high. Rates often went above 15%, reaching peaks near 18%. This made buying homes very expensive. The high rates were due to inflation and tight monetary policies.
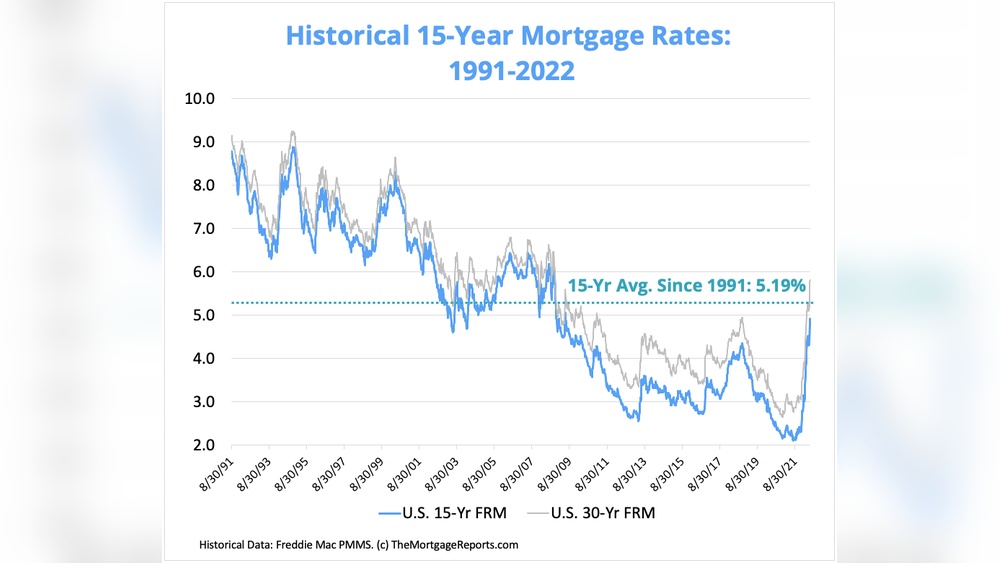
During the 1990s and 2000s, rates fell steadily. They dropped to about 7-8% in the 1990s and then to around 6% in the early 2000s. This helped more people afford homes, boosting the housing market.
After the Great Recession in 2008, rates hit historic lows. The Federal Reserve set near-zero interest rates. Many mortgages were below 5%, some even near 3%. This supported economic recovery and home buying.
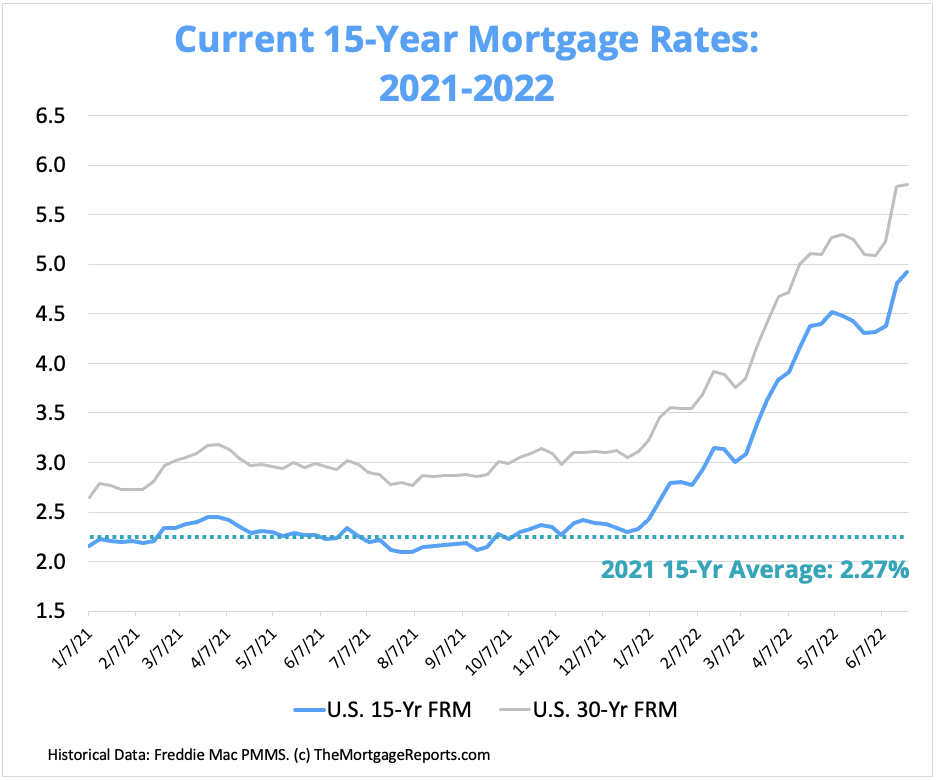
The 2020s saw more ups and downs. Rates fell to record lows near 2.5% in 2020 but then rose again due to inflation concerns. Today, rates hover around 6%, affecting housing affordability.
Factors Influencing Mortgage Rates
Federal Reserve policies play a big role in mortgage rates. When the Fed changes interest rates, mortgage rates often follow. The Fed may also buy or sell bonds to control money supply. This affects how much banks pay to borrow money.
Economic growth and inflation impact mortgage rates too. Strong economic growth can cause rates to rise. Inflation means prices go up, and lenders want higher rates to keep up. If inflation is low, rates tend to stay low.
Housing market dynamics also matter. High demand for homes can push rates higher. If many people want to buy houses, lenders may raise rates. On the other hand, slow housing markets can lead to lower rates.
Global economic events affect US mortgage rates as well. Problems in other countries can cause investors to seek safe US bonds. This demand can lower mortgage rates. Events like wars or trade disputes also create uncertainty, impacting rates.
Key Historical Mortgage Rate Milestones
Mortgage rates have hit record highs above 18% in the early 1980s. The lowest rates dropped below 3% during the 2020s. These extreme shifts shaped the housing market strongly.
Quantitative easing by the Federal Reserve helped lower rates after the 2008 crisis. This policy involved buying bonds to push rates down and boost spending.
Major policy changes often triggered rate shifts. For example, the Fed raising rates in the late 2010s caused mortgage rates to climb. These moves reflect attempts to control inflation and economic growth.
Mortgage rates also react fast during market crises. The 2008 financial crash and the 2020 pandemic caused sharp rate drops. Investors seek safe assets, pushing rates down during uncertain times.
Regional Insights: Austin, Texas Mortgage Rates
Austin mortgage rates often run slightly below the national average. This trend reflects the city’s strong local economy and steady job growth. Rates here usually track the national movement but show less volatility.
The Texas economy impacts mortgage rates in Austin significantly. Energy, tech, and real estate sectors drive demand, influencing lending costs. Low unemployment and population growth keep rates competitive.
Here is a quick comparison:
| Region | Average Mortgage Rate (2023) | Rate Trend |
|---|---|---|
| Austin, Texas | 5.3% | Stable with slight decreases |
| National Average (US) | 5.5% | Fluctuating with economic news |
Local market trends show steady home sales and consistent mortgage activity. The strong job market and affordable housing keep rates attractive. This helps many families buy homes in Austin.
Using Mortgage Rate Charts To Save Money
Mortgage rate charts help spot the best time to borrow. Watching the charts over months shows when rates are low. Borrowers can save thousands of dollars by choosing the right moment.
Fixed rates stay the same for the loan term. Adjustable rates change over time. Fixed rates offer stability, while adjustable rates may start lower but can rise.
Charts show past trends to help guess future moves. Rates often rise with inflation or economic growth. They tend to fall during slow economic times.
Many websites and apps track mortgage rates daily. They send alerts when rates drop. Use these tools to stay updated and act fast.
Mortgage Rate Data Sources And Reliability
Freddie Mac and Bankrate offer reliable weekly data on mortgage rates. Freddie Mac collects data from lenders nationwide, providing a trusted benchmark for average rates. Bankrate compiles rates from various sources to show current trends and historical changes.
The Federal Reserve Economic Data (FRED) provides detailed historical mortgage rate charts. It collects data directly from government and financial institutions. This source is valuable for understanding long-term trends and economic impacts.
Industry reports and analytics come from banks, mortgage companies, and financial analysts. These reports explain why rates move up or down. They offer insights into economic events and policy changes affecting mortgage costs.
Interpreting this data helps make better decisions. Look at rate trends over time. Consider economic factors like inflation and Federal Reserve actions. Use trusted sources to compare and confirm information before deciding on a mortgage.

Frequently Asked Questions
What Are 30-year Mortgage Rates Through History?
30-year mortgage rates peaked near 18. 63% in the early 1980s. They have since declined, reaching around 2. 65% in recent years. Rates fluctuate due to economic conditions, Federal Reserve policies, and inflation trends. Historical data helps predict future mortgage costs.
Will We Ever See A 3% Mortgage Rate Again?
Mortgage rates near 3% are rare today due to economic factors and inflation. Rates may drop, but likely not soon.
What Is The 3 7 3 Rule In Mortgage?
The 3-7-3 rule in mortgage means a lender must respond within 3 days, process the loan in 7 days, and close within 3 weeks.
Will Mortgage Rates Go Down To 5% In 2027?
Mortgage rates depend on inflation, Federal Reserve policies, and economic growth. Predicting a 5% rate in 2027 remains uncertain.
Conclusion
Mortgage rates have changed a lot over the years. Understanding their history helps you see the big picture. Rates depend on many factors like the economy and government policies. Watching these trends can guide your home buying decisions. Knowing when rates were high or low shows how markets shift.
Keep an eye on charts to stay informed. This knowledge makes you a smarter borrower. History shows rates will continue to move, so stay prepared.